Overview
Enterprise networks are vast, complex ecosystems where a single broken switch, loose cable, or configuration error can cause massive business downtime. Traditionally, network administrators spent hours digging through command-line interfaces and fragmented physical charts to locate a failure.
To solve this, I designed an AI-driven, Multi-Layer Network Troubleshooting Interface for Platform ONE.
This feature empowers NetOps teams to instantly visualize network anomalies across physical and virtual layers, utilizing an interactive AI expert panel to diagnose and fix critical infrastructure outages with a single click.
My Role
User Research & Cognitive Mapping
Interviewed network engineers to understand their mental models during high-stress outage scenarios and mapped out their troubleshooting workflows.
Data Visualization & System Architecture
Designed multi-layered node diagrams that translate complex backend data into intuitive, interactive physical and virtual network topologies.
AI Interaction Design (AI/UX)
Created conversational UI patterns, contextual prompt mechanisms, and progressive disclosure strategies for the platform’s AI assistant to ensure administrative control and trust.
Design Principles
Visual Continuity Across Layers
Users must be able to toggle seamlessly between physical hardware topography and virtual data flows without losing context or their place in the system.
Explainable & Actionable AI
The AI assistant must never just give a generic answer; it must visually isolate the root cause on the dashboard and provide a verifiable, rollback-ready path to resolution.
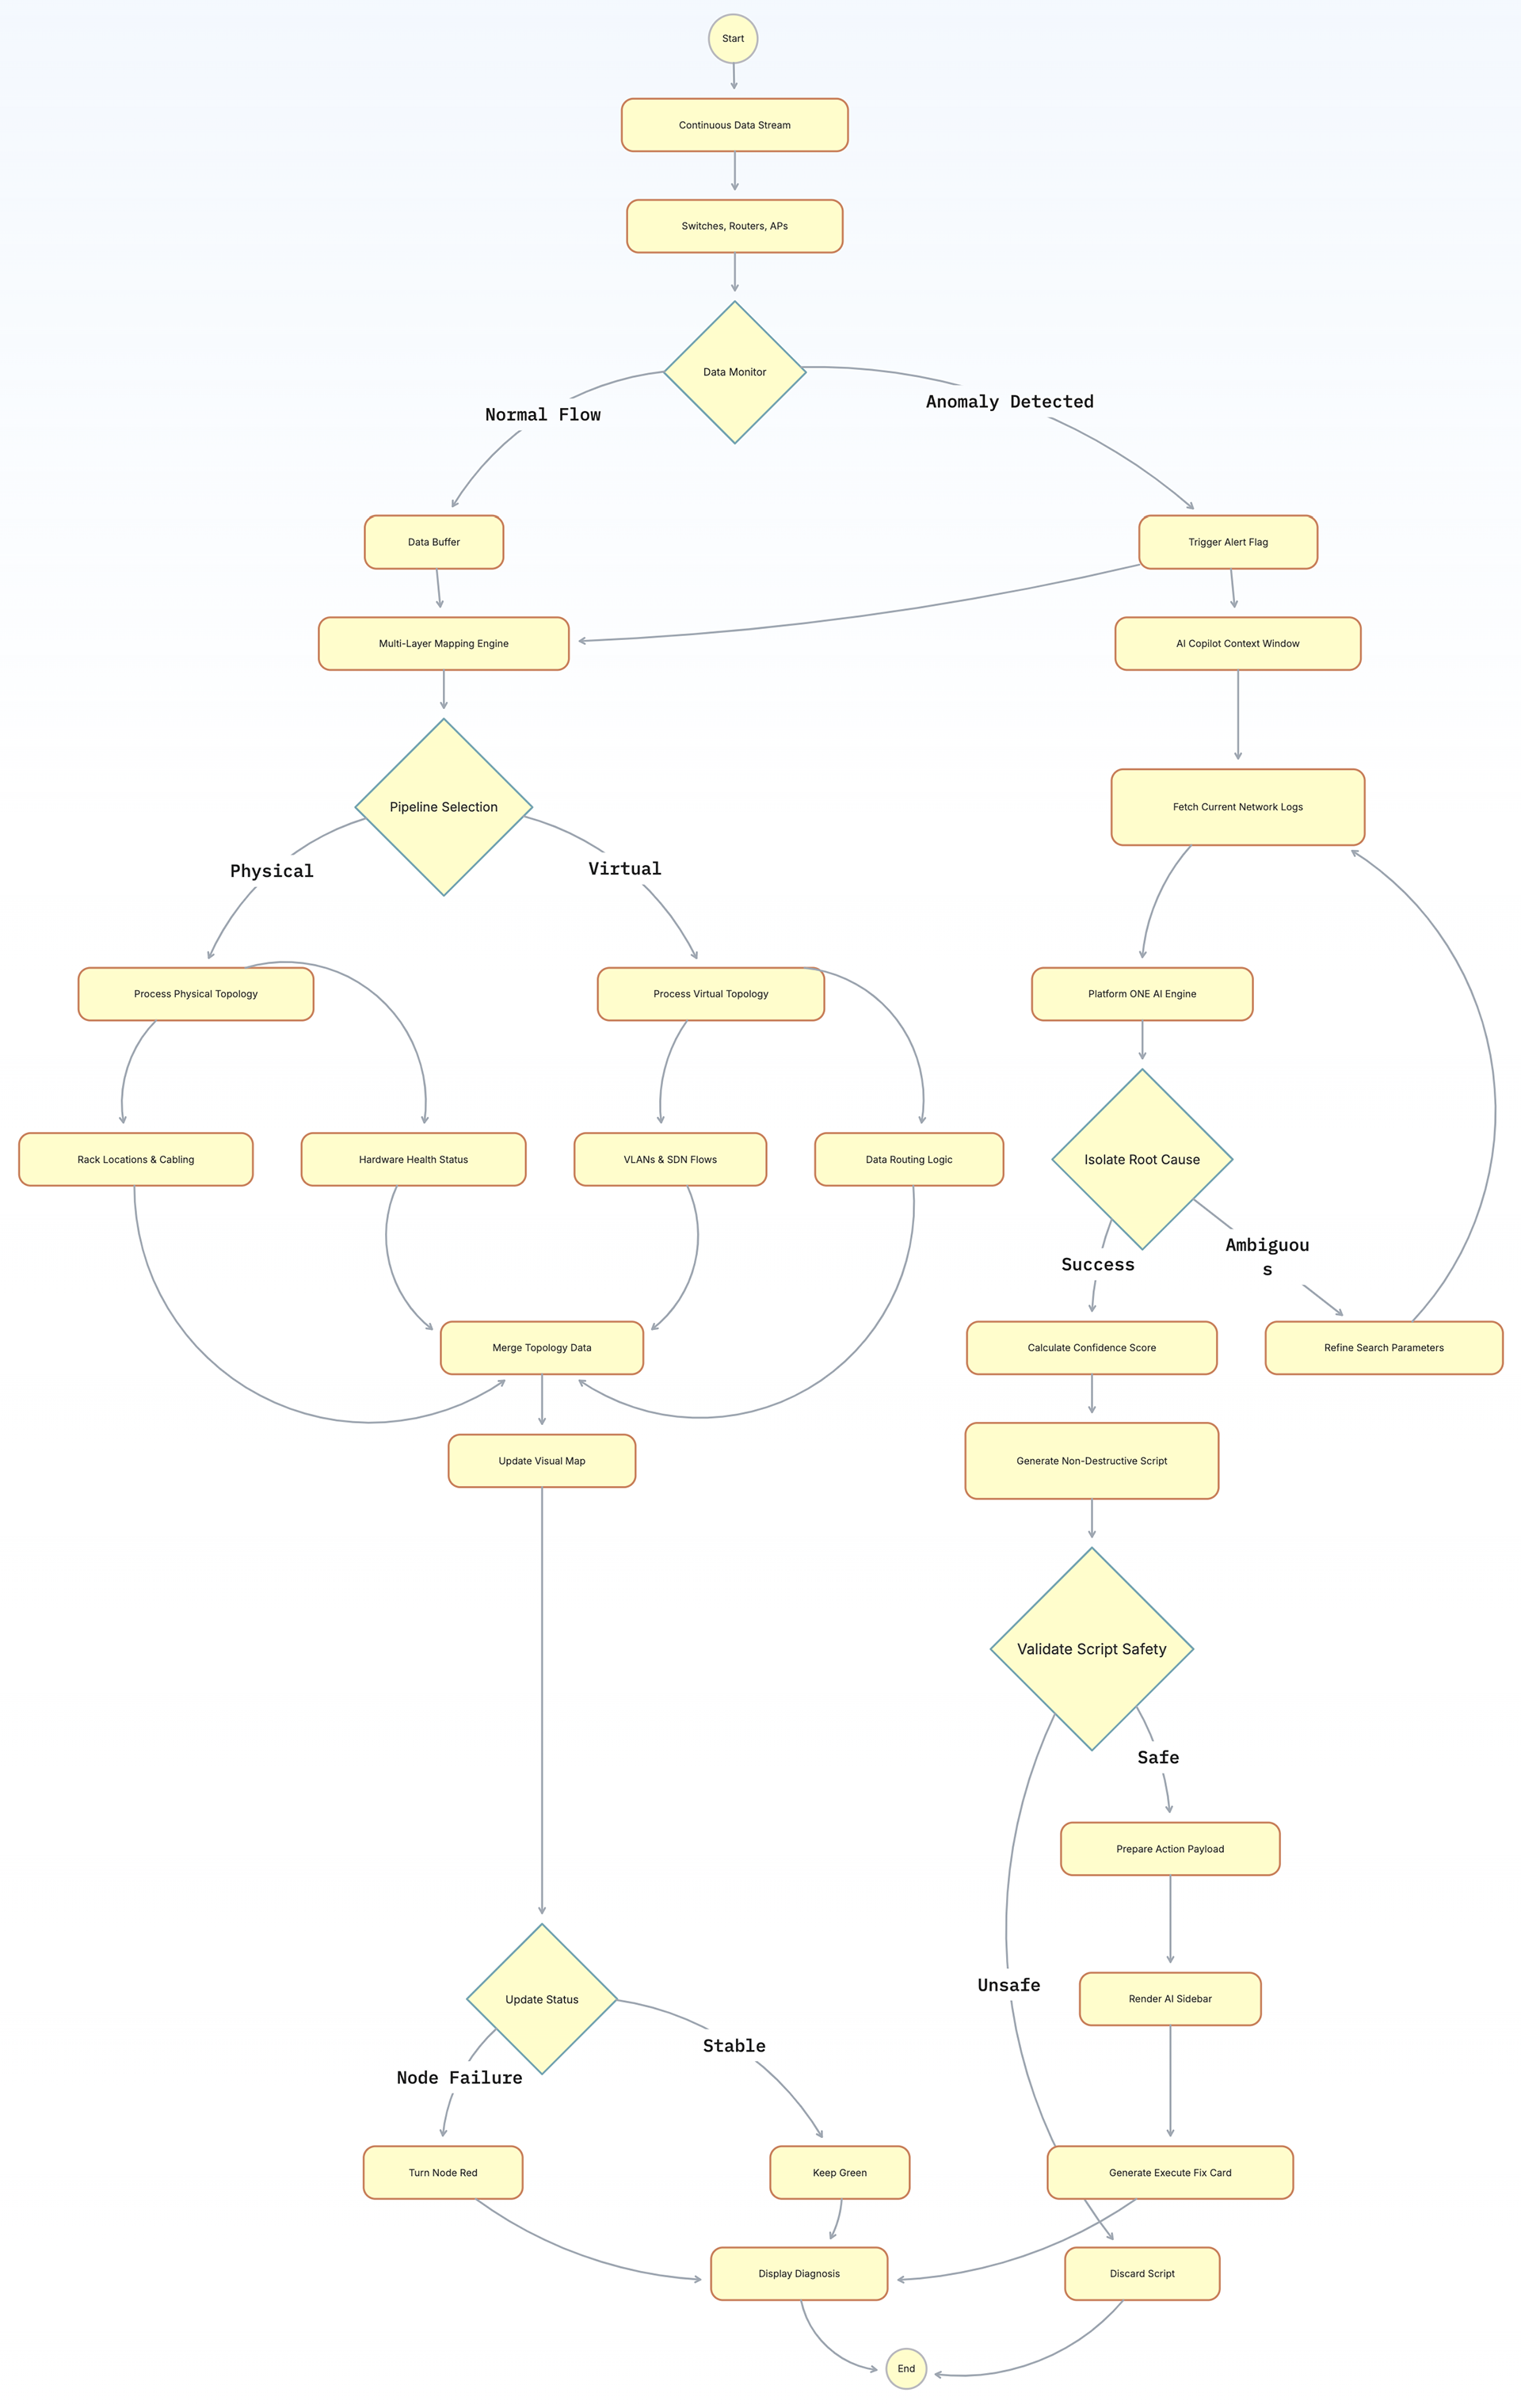
System Architecture Workflow
We mapped out a comprehensive Network Diagnostics flow to visualize:
- Real-time system telemetry and anomaly trigger points.
- How the UI surfaces system alerts without causing alert fatigue.
- The data loop between the physical map layout, the virtual overlay, and the AI context-window logic.
Design High-Fidelity Mockups
Using Platform ONE's existing enterprise design system, I engineered high-fidelity mockups focusing on three distinct states:
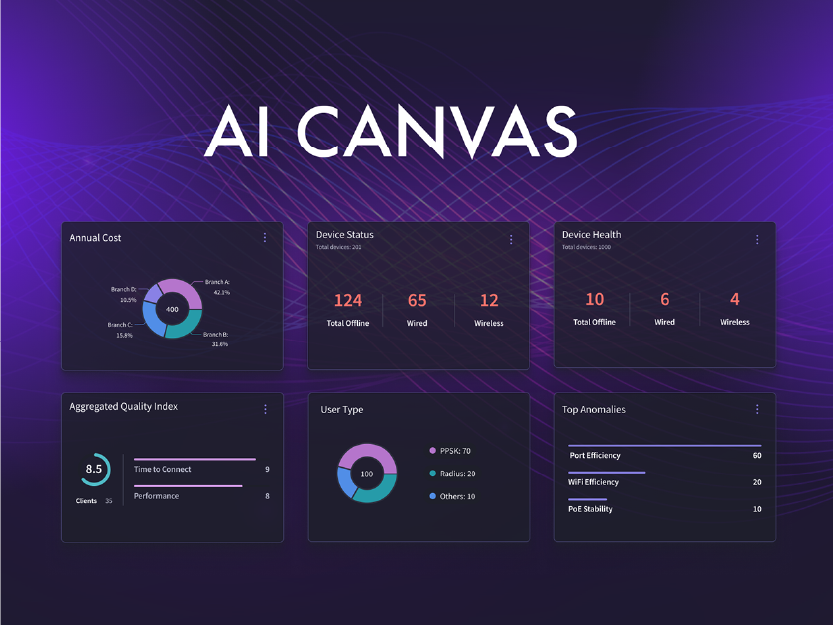
The Multi-Layer Map
A dark-mode optimized topology canvas using color-coded nodes to denote device health, featuring an interactive layer toggle.
The Copilot Sidebar
A contextual conversational panel that slides out automatically during critical alerts, offering a natural language summary of the issue.
The Guided Resolution UI
A clear, high-contrast action card allowing admins to preview the AI-suggested fix and execute a one-click automated resolution directly from the dashboard.
Outcomes
Mean Time to Resolution (MTTR)
Drastically reduced network diagnostic cycles from hours to minutes by eliminating manual CLI script auditing.
Reduced Cognitive Load
Aggregated siloed hardware charts and virtual data paths into a single, cohesive source of truth.
Impact Metrics
- Achieved a 45% reduction in time-to-isolation for critical network bottlenecks during beta testing.
- Scored a 9/10 User Satisfaction (CSAT) rating among senior enterprise network administrators for system trust and AI clarity.
Troubleshooting Network Issues
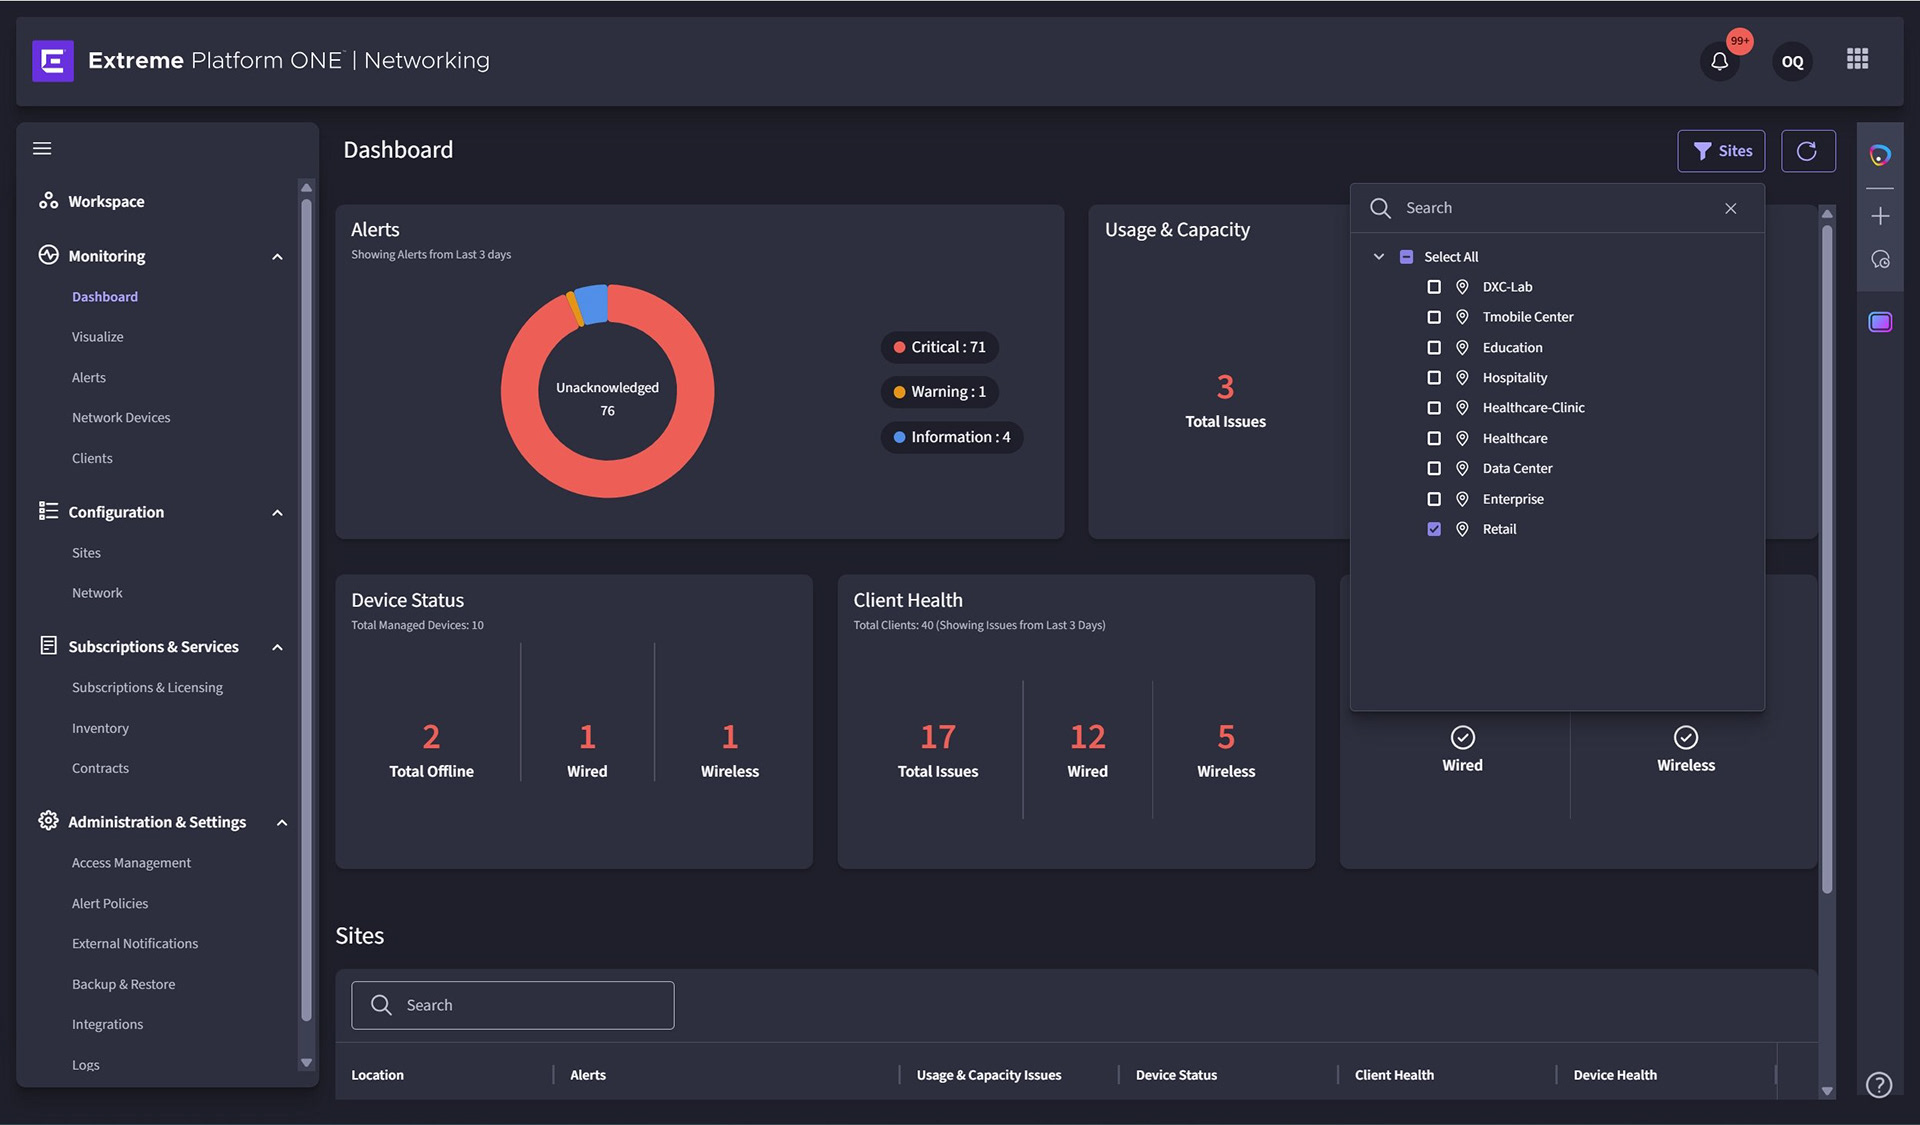
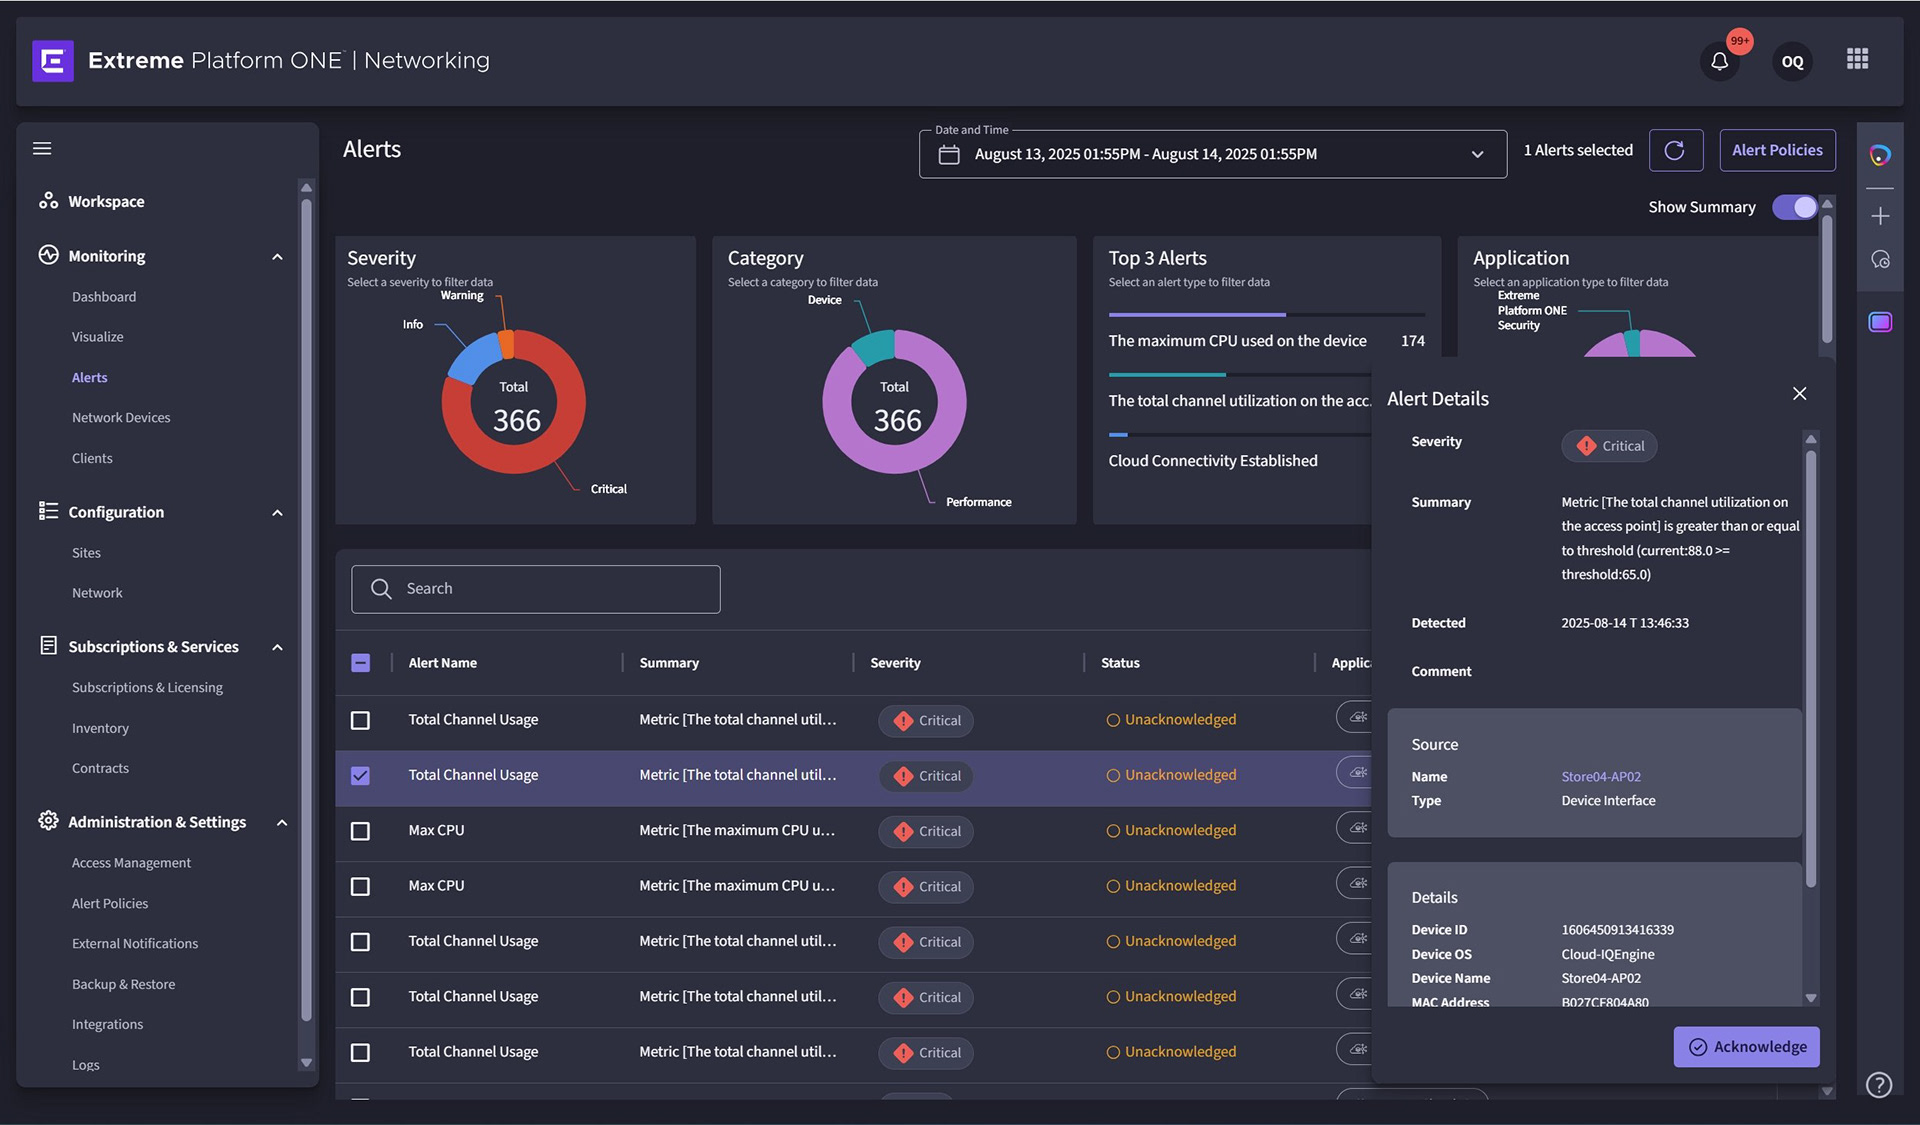
With quick links, admins jump into the store dashboard, where the Alerts widget surfaces the problem in seconds.
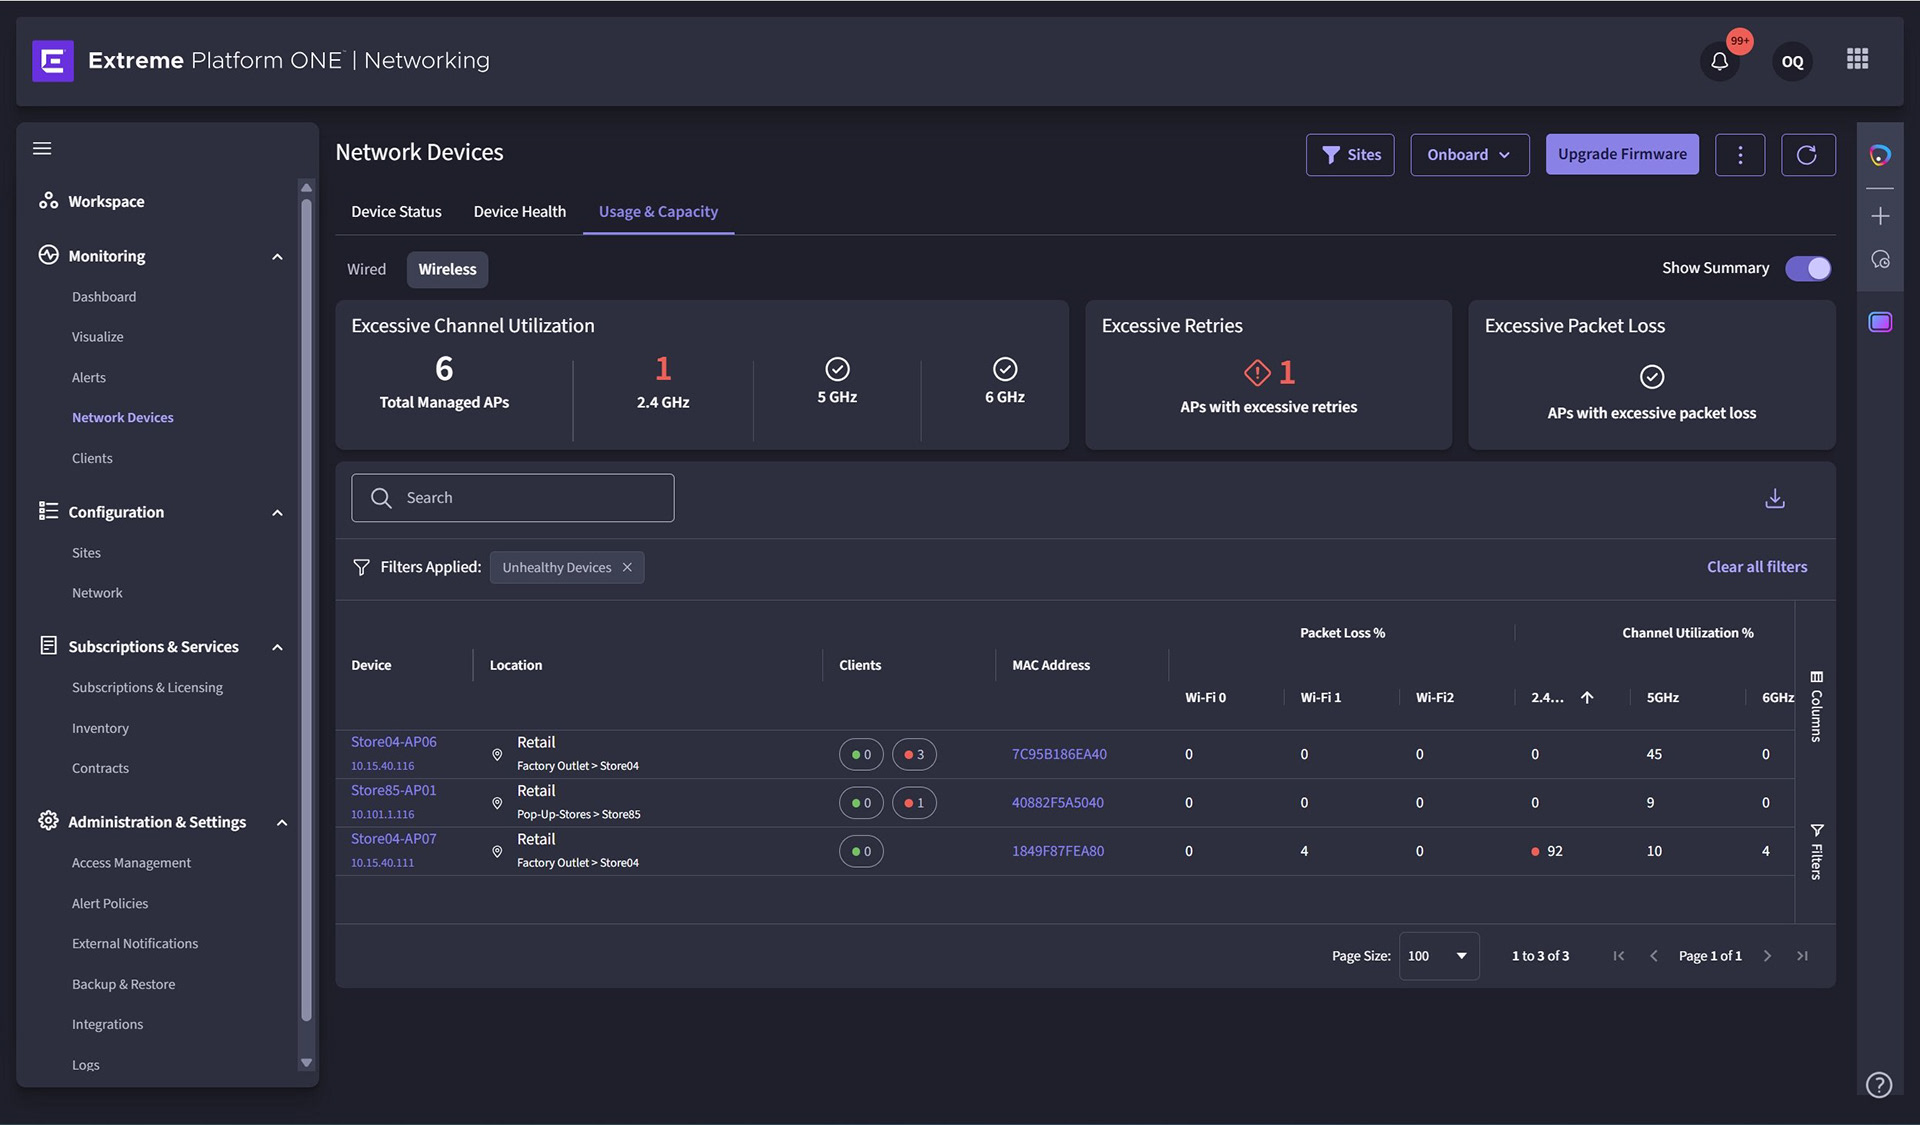
The dashboard shows the 2.4 GHz network is impacted, with one issue flagged for review.
Clear visualizations highlight access points with high 2.4 GHz utilization, making it easy to identify the one causing the issue.
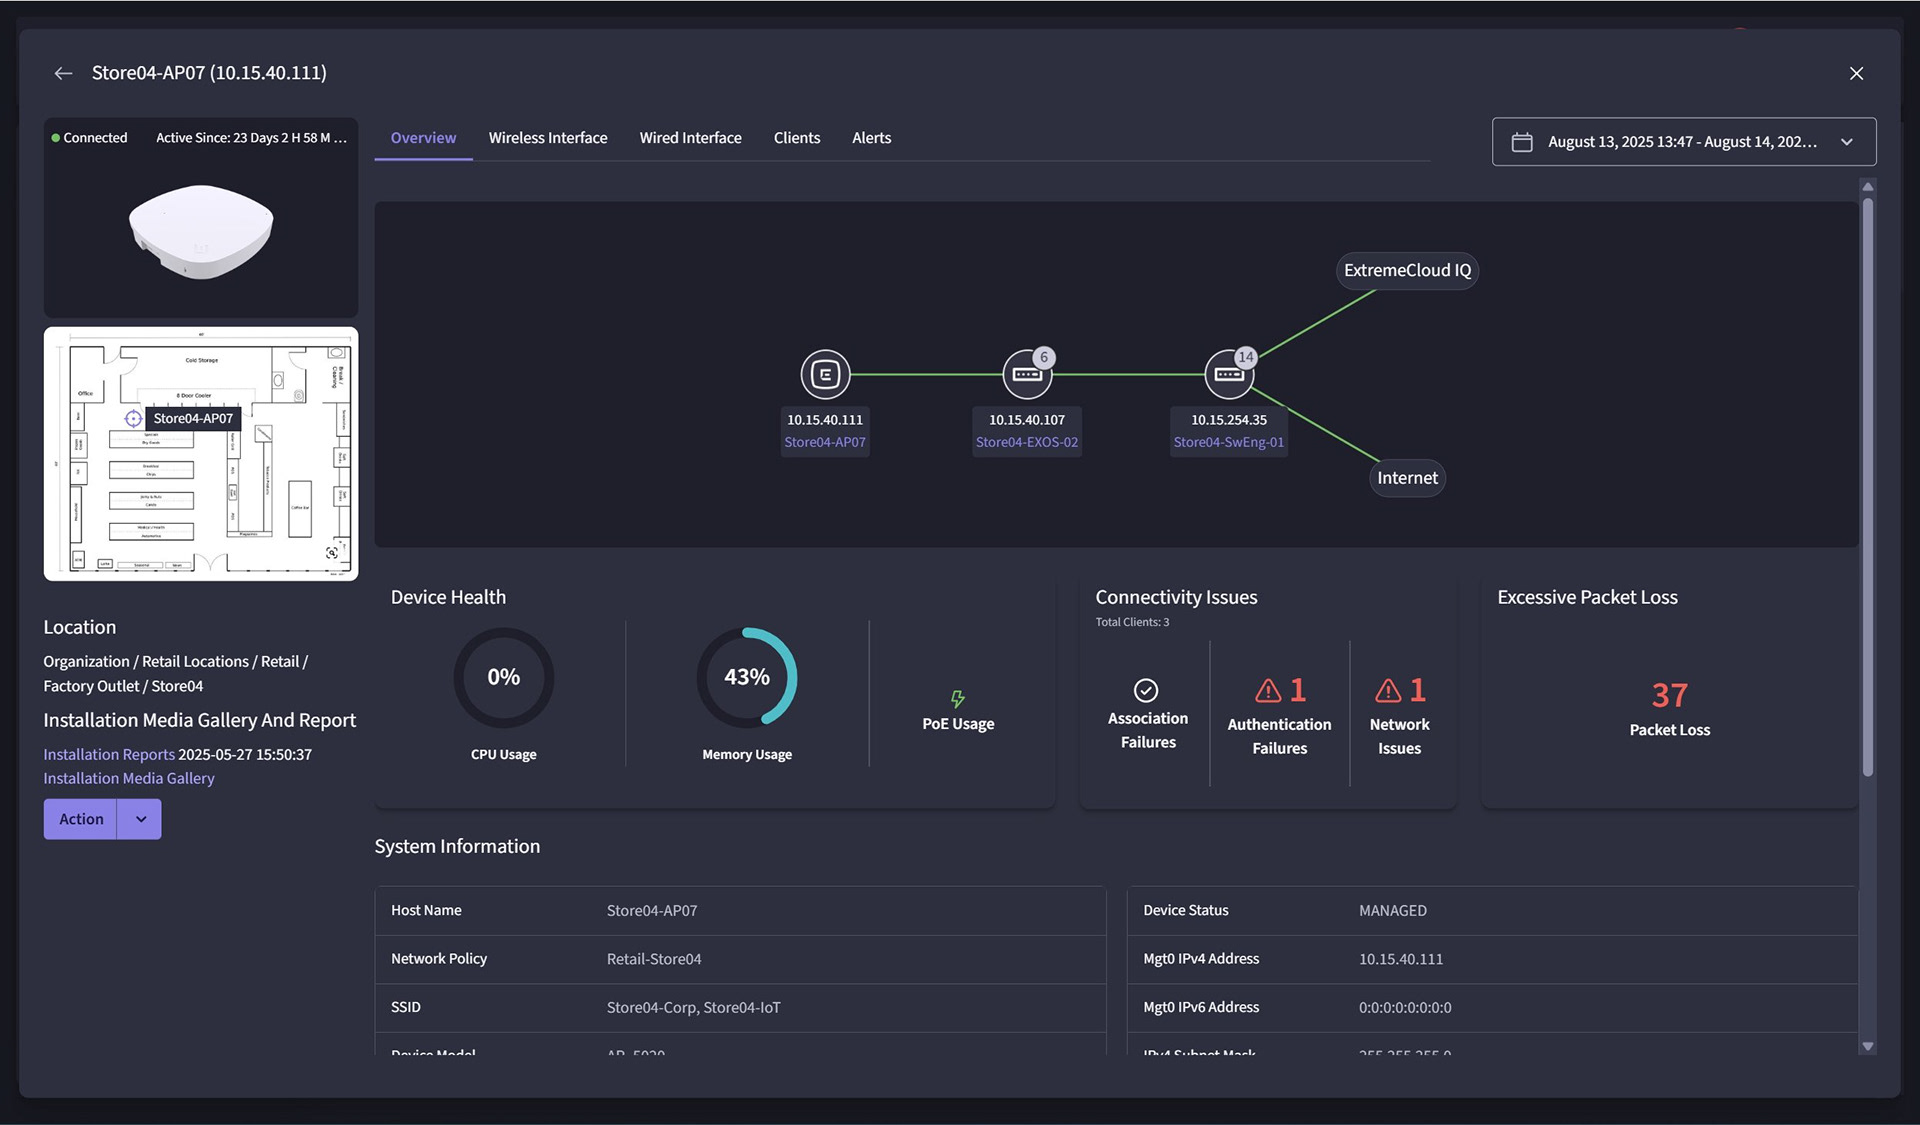
The network topology shows how the AP connects to the infrastructure, including its location, upstream path, and the store systems and operations it impacts.
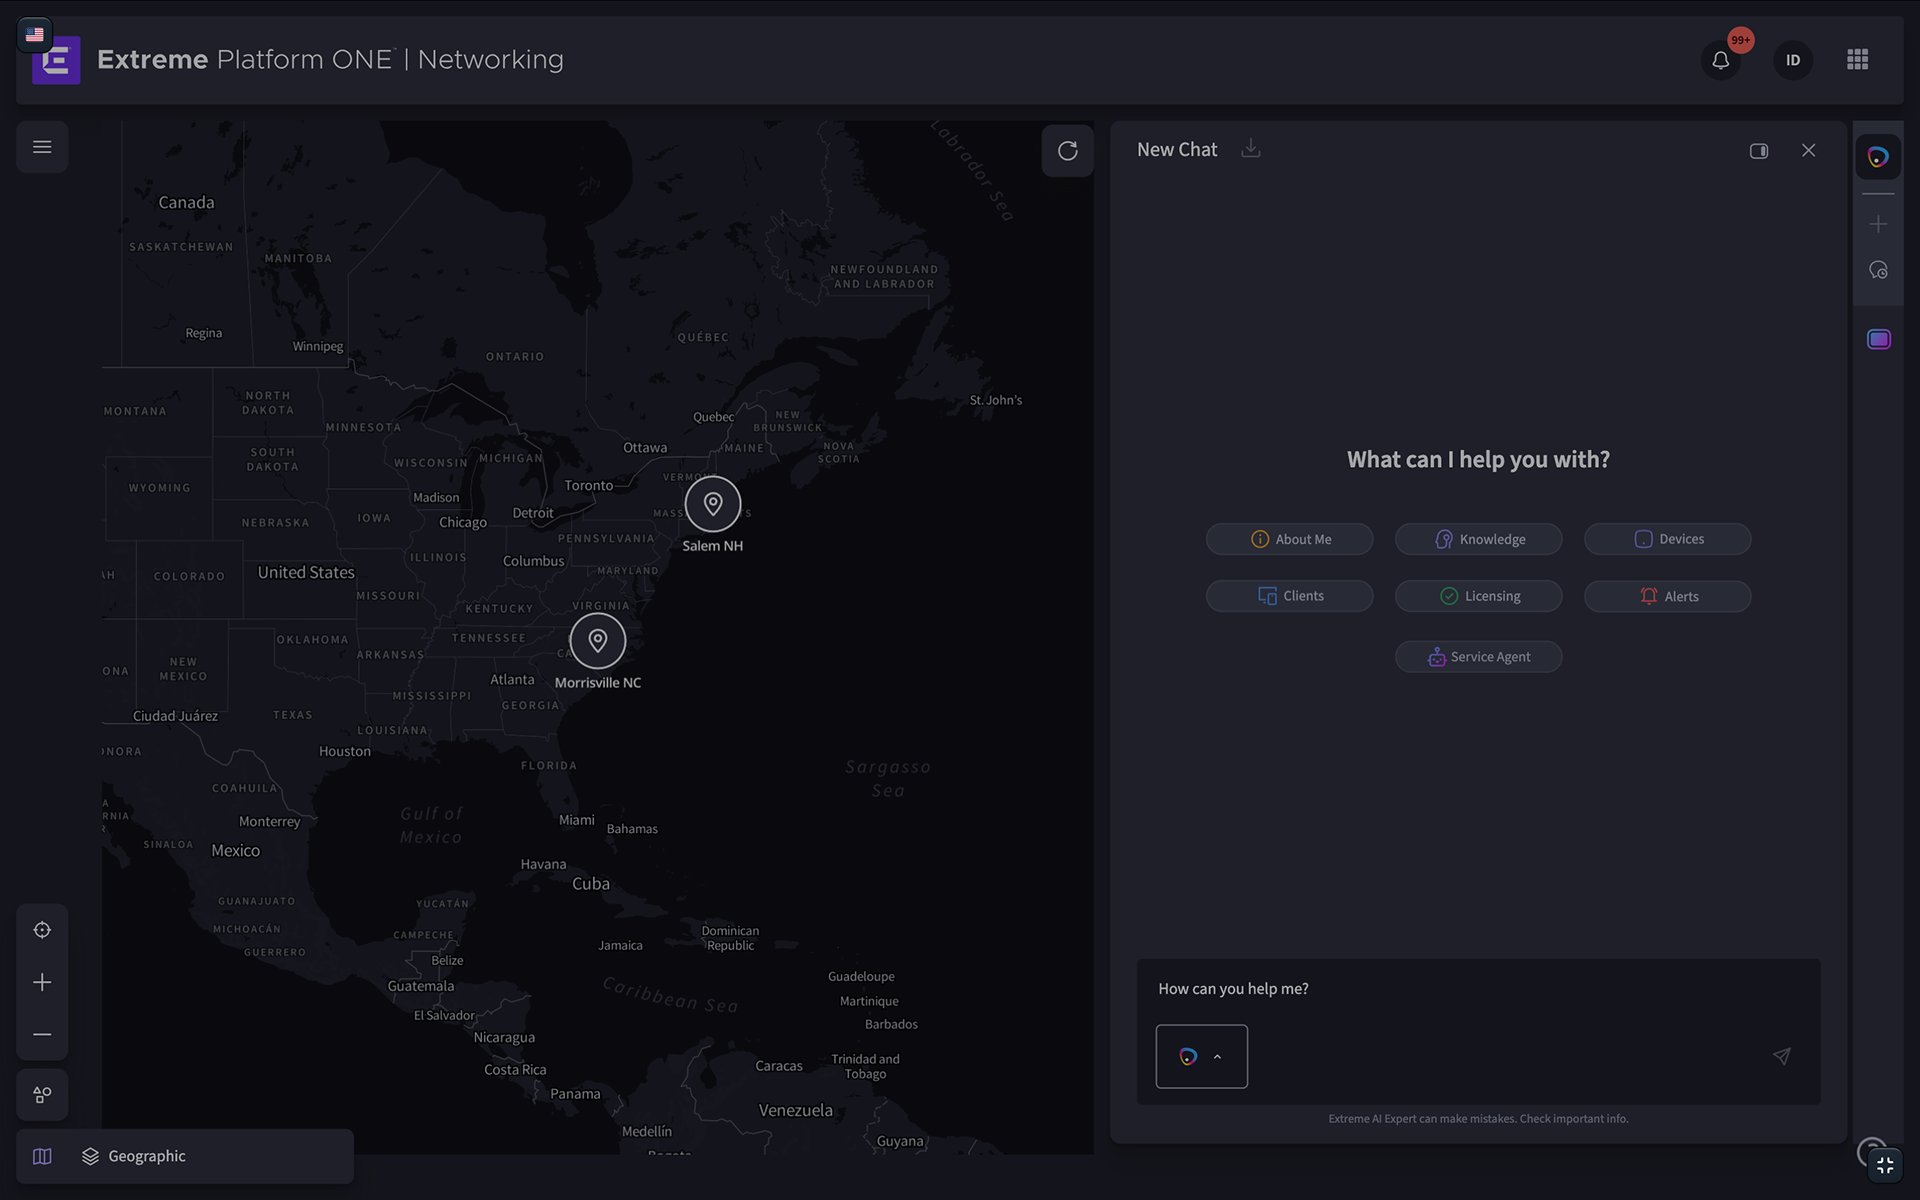
Instead of searching through manuals when troubleshooting, upgrading, or rolling out a new service, just ask AI Expert.
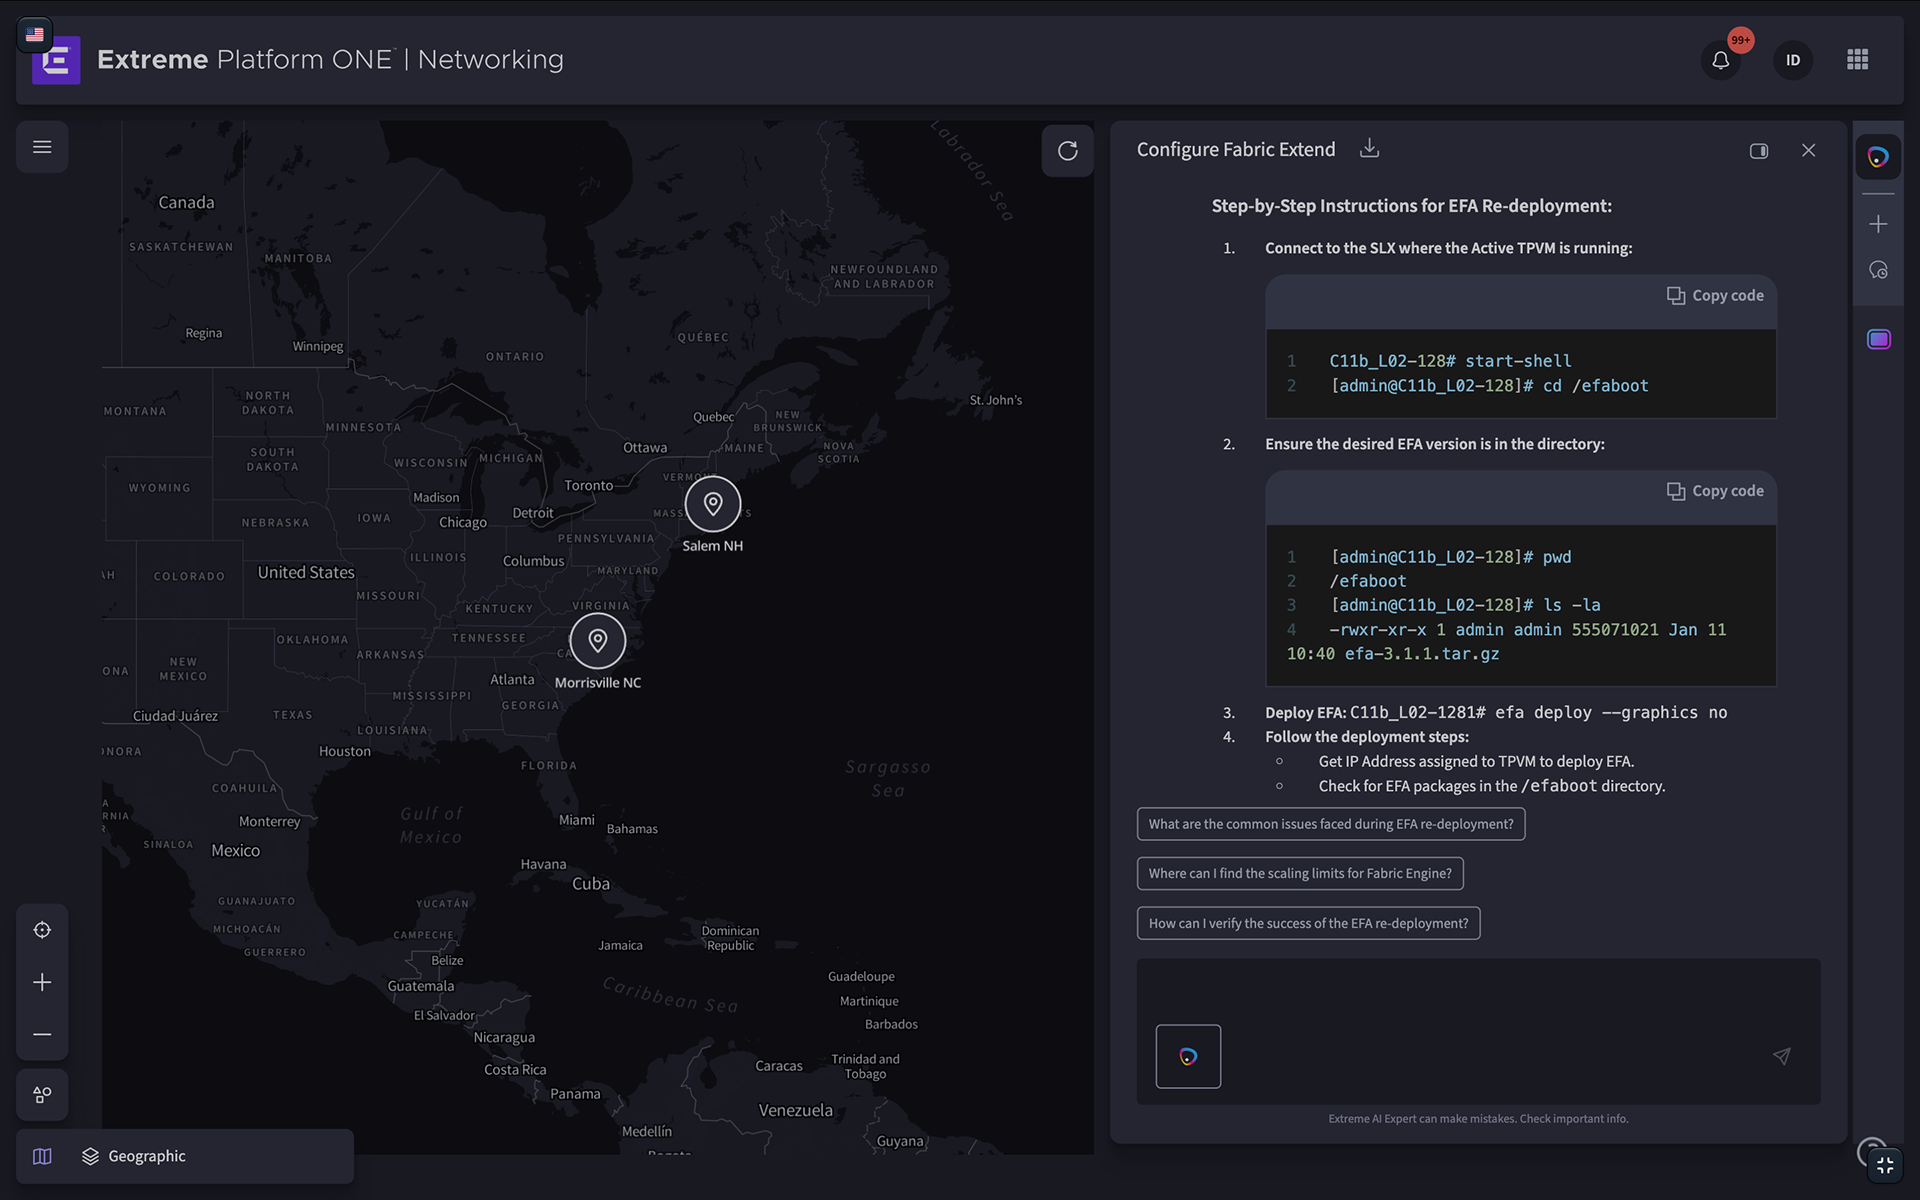
When deploying or scaling Fabric, AI Expert provides step-by-step insights for a seamless, secure setup. By consolidating resources, it saves time and removes guesswork.